Installation
You can install the development version of vlindersRarefaction from GitHub with:
# install.packages("devtools")
devtools::install_github("PietrH/vlindersRarefaction")
Scope
This simple and experimental package converts a dataframe with a known format to the format the iNEXT package expects for abundance and incidence frequency data.
The package was written with exactly this file in mind as a draft, with little flexibility. This means that your file will need the following columns as a minimum:
- date
- species_name
- year
- number
Any number of extra columns can be provided to split the rarefaction on, these are called assemblages in the context of iNEXT.
#> Rows: 2,976
#> Columns: 5
#> $ date         <date> 2009-06-19, 2009-07-01, 2009-08-13, 2009-08-30, 2010-06-…
#> $ species_name <chr> "Bruine huismot", "Oranje iepentakvlinder", "Oranje worte…
#> $ year         <dbl> 2009, 2009, 2009, 2009, 2010, 2010, 2010, 2010, 2010, 201…
#> $ number       <dbl> 1, 1, 1, 1, 1, 1, 1, 1, 1, 1, 1, 1, 1, 1, 1, 1, 1, 1, 1, …
#> $ MicroMacro   <chr> "Micro", "Macro", "Macro", "Macro", "Macro", "Macro", "Ma…
This is a basic example on how you can plug this package into iNEXT:
library(vlindersRarefaction)

## convert to formats iNEXT is expecting, then calculate rarefaction curves
rare_out_inc <-
  iNEXT::iNEXT(convert_to_incidence_freq(warande),
               datatype = "incidence_freq",
               nboot = 2 # for speed
               )
rare_out_abun <-
  iNEXT::iNEXT(convert_to_abundance(warande),
               datatype = "abundance",
               nboot = 2 # for speed
               )
## and plot them:
iNEXT::ggiNEXT(rare_out_abun) + ggplot2::ggtitle("Abundance based")
#> Warning in ggiNEXT.iNEXT(rare_out_abun): invalid color.var setting, the iNEXT
#> object do not consist multiple assemblages, change setting as Order.q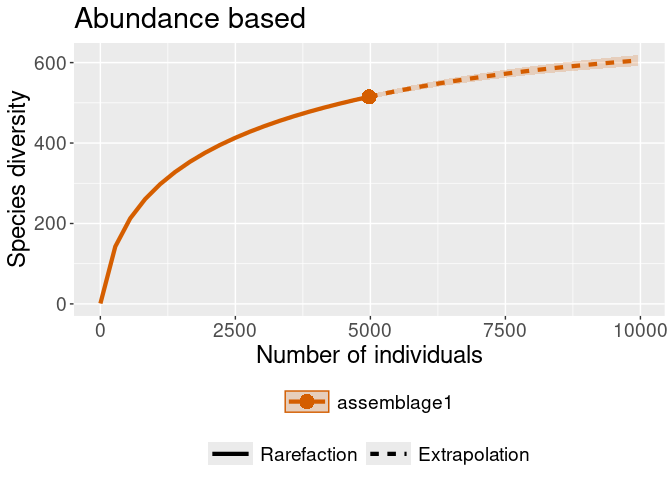
iNEXT::ggiNEXT(rare_out_inc) + ggplot2::ggtitle("Incidence based")
#> Warning in ggiNEXT.iNEXT(rare_out_inc): invalid color.var setting, the iNEXT
#> object do not consist multiple assemblages, change setting as Order.q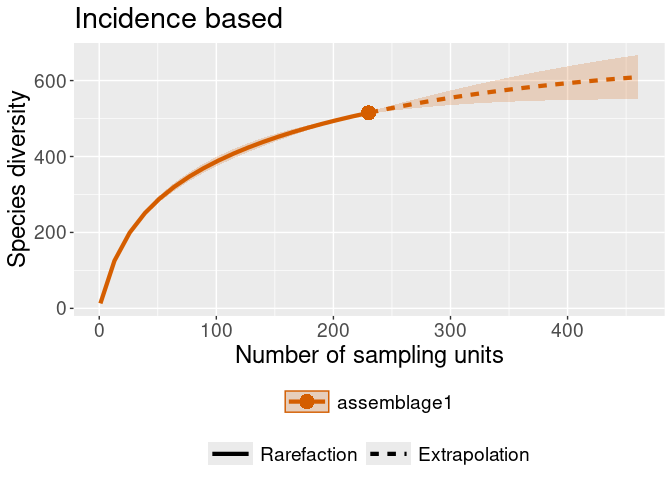 Now with an assemblage set:
# Let's generate some random area's for the observations to belong to.
warande_gebieden <- warande %>%
dplyr::mutate(gebied =
sample(
c("gebied_a", "gebied_b"),
nrow(warande),
replace = TRUE)
)
rare_out_inc_gebied <-
iNEXT::iNEXT(convert_to_incidence_freq(warande_gebieden, gebied),
datatype = "incidence_freq",
nboot = 2 # for speed
)
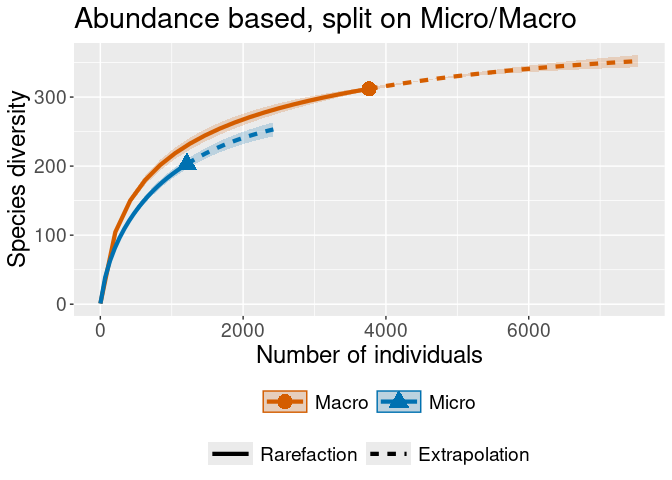
rare_out_abun_micromacro <-
iNEXT::iNEXT(convert_to_abundance(warande, MicroMacro),
datatype = "abundance",
nboot = 2 # for speed
)
## and plot them:
iNEXT::ggiNEXT(rare_out_inc_gebied) + ggplot2::ggtitle("Incidence based, with areas")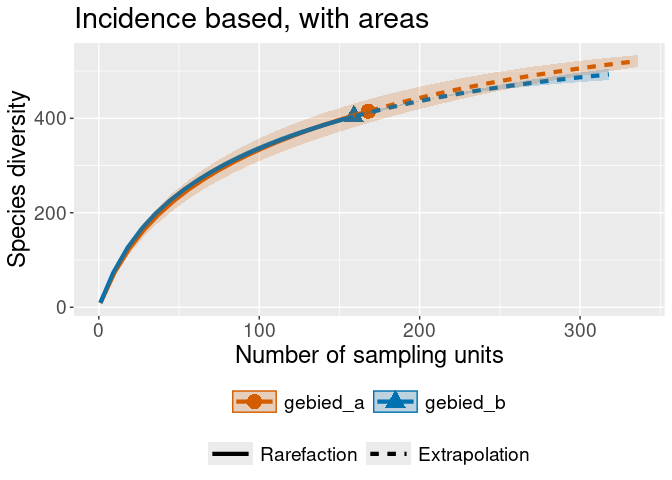
iNEXT::ggiNEXT(rare_out_abun_micromacro) + ggplot2::ggtitle("Abundance based, split on Micro/Macro")